

How to trace failed agent tool calls without losing or doubling errors
When a tool fails, the agent hands the error to the model and the request still succeeds. Mark the tool span, record the exception once, and report it from the handler.
Andrew Babo3 min read
On this page

Set the tool span to ERROR with error.type when the tool fails for good, record the exception once, and keep retried attempts as child spans or events. Then report the final failure to your error tracker from the code that hands it to the model. Nothing else will: in our 60 agent runs, no failure reached the error tracker on its own.
What the OpenTelemetry rules say#
The error conventions are short (recording errors):
- A span that ends without error leaves its status unset.
- A failed operation sets status
Erroranderror.type. - Errors that were “retried or handled” should not mark the operation as failed.
- The same exception should not be recorded more than once.
The trace spec adds when to attach an exception event: only if the exception is still unhandled when the span ends (exceptions).
For an agent, that means the tool span fails, and the agent span does not, because the agent handled the error by giving it to the model.
One failed refund, span by span#
On 26 October 2026 we ran a support agent whose refund_payment tool calls a payment provider and retries once on timeout. With the provider down, every run produced this tree:
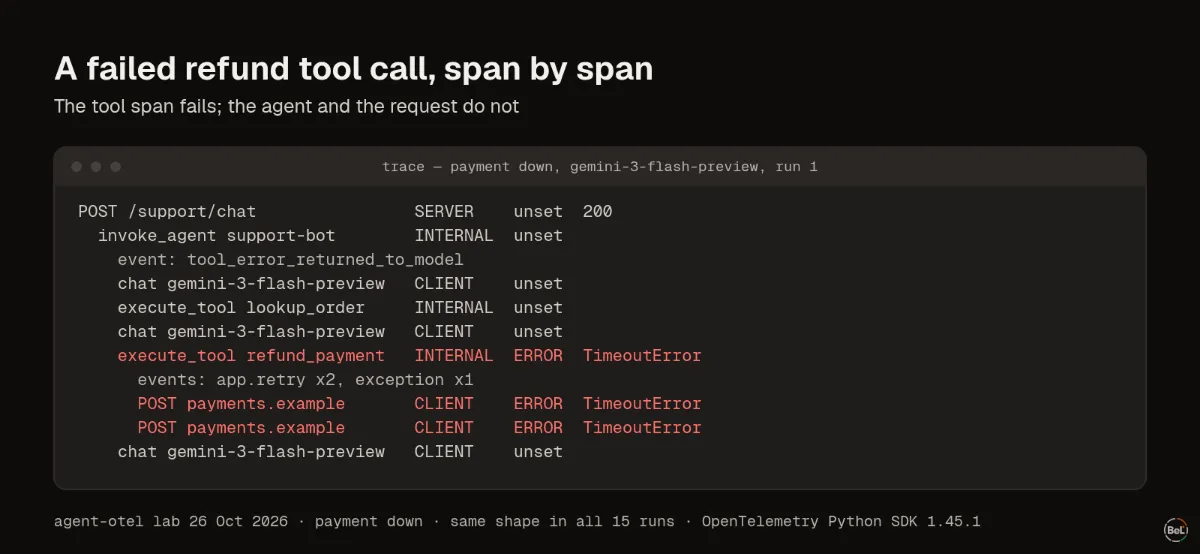
Each payment attempt is its own CLIENT span and fails on its own. The tool span records two app.retry events, then fails with one exception event. The agent span stays unset and carries a plain event saying it passed the error to the model. The request returns 200.
That tree is correct, and it is also why failures go unseen. Anything that watches failed requests, or root spans in error, sees a clean run.
Three ways to report, counted#
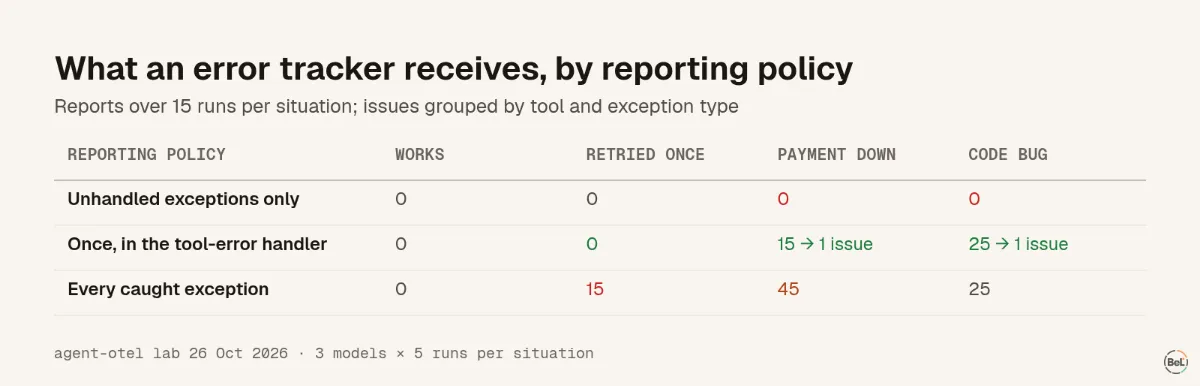
- Unhandled exceptions only, which is what most setups do by default: 0 reports, in every situation.
- Once, in the tool-error handler: 15 reports for the payment outage and 25 for the code bug, each one issue.
- Every caught exception, attempts included: 45 for the outage, plus 15 for timeouts that the retry fixed. That pages people for problems that solved themselves; stop paging on every exception covers why.
The code bug produced 25 reports from 15 runs because two of the three models called the broken lookup twice in every run. Counting by error.type shows that pattern quickly.
The handler, in code#
In your own loop, report where you catch:
import sentry_sdktry: result = execute_tool(call)except Exception as error: sentry_sdk.capture_exception(error) # once, the final failure result = {"error": type(error).__name__}With the OpenAI Agents SDK, the default handler returns “An error occurred while running the tool. Please try again.” to the model and, by default, logs the error only at debug level (Agents SDK source). Pass your own failure_error_function to report it:
def report_tool_error(ctx, error: Exception) -> str: sentry_sdk.capture_exception(error) return "An error occurred while running the tool."@function_tool(failure_error_function=report_tool_error)def refund_payment(order_id: str, amount: float) -> dict: ...Keep the retry loop inside the tool, and report nothing for attempts that a later attempt fixed.
Where Belvador fits#
Belvador's Python setup uses the official sentry-sdk with your Belvador DSN, so capture_exception in the handler sends one event and the node groups repeats into an issue (Python guide). Belvador does not create spans and does not turn exceptions inside spans into issues; traces arrive over OTLP and sit next to errors on your node, as the OpenTelemetry overview describes. Alerts fire on new issues, regressions and sudden rises, not on every event.
For the bigger picture, see AI agent observability. GenAI conventions in practice covers the attributes on the spans above.
Part of the guide: AI agent observability: the failures that still return 200
Related posts
All posts
Engineering
AI agent observability: the failures that still return 200
We ran a support agent 60 times with seeded failures. Every failed refund returned HTTP 200 and reached no error tracker. Only the trace showed it, and customers heard the truth in 13 of 30 failures.
Andrew Babo4 min read
Engineering
OpenTelemetry GenAI conventions in practice: what gets recorded
We ran the official OpenAI instrumentation for Python in five settings. By default it uses older attribute names, records nothing for the Responses API and leaves agent and tool spans to you.
Andrew Babo3 min read
Read next in the docs
See your own production errors this way
Belvador runs on your own Hetzner server: errors, cron jobs, uptime and traces, with your data staying yours.